

The math behind a single compliance number, and why binary scoring quietly breaks it.
Quick answer: Program health scores lose credibility with the board when they’re built on binary effective/ineffective ratings. A control that’s mostly working gets rated the same as one that’s completely broken, because there’s no option in between. That drags the score down in a way that doesn’t match reality, and once the board catches the mismatch once, they stop trusting the number, not just the score that day. The fix is three changes to how the score gets built: more than two rating tiers, weighting by control criticality, and separating design effectiveness from operational effectiveness.
The Moment the Board Stops Trusting the Number
Here’s a pattern that shows up across compliance teams running mature, multi-framework programs: a program that is, in practice, doing fine, reports a failing health score, and nobody in the room believes the score is measuring what it claims to measure.
One financial services compliance team hit this directly. Their program health score was calculated as a strict pass or fail: if every linked control was rated “effective,” the program scored well; if even a handful of controls were anything less than fully effective, the score cratered. The catch was that their control assessment tool only offered two ratings, effective or ineffective. There was no middle option for a control that was mostly working, partially implemented, or effective in design but not yet fully operating. So, every borderline control got rated “ineffective” by default, because that was the only honest option available below “effective.” The health score, in turn, reflected a program that looked like it was failing across the board.
It wasn’t failing. It was a normal, maturing program with a normal number of controls in progress. But the number said otherwise, and the compliance team couldn’t explain the gap without walking the board through the scoring mechanics line by line. The issue got escalated internally to the CISO, not as a request for a nicer dashboard, but as a reporting credibility concern. That’s a different problem than “the score is bad.” A bad score is expected sometimes. A score nobody trusts is a different kind of failure, and it’s much harder to walk back.
The Math Problem Hiding Inside a Single Score
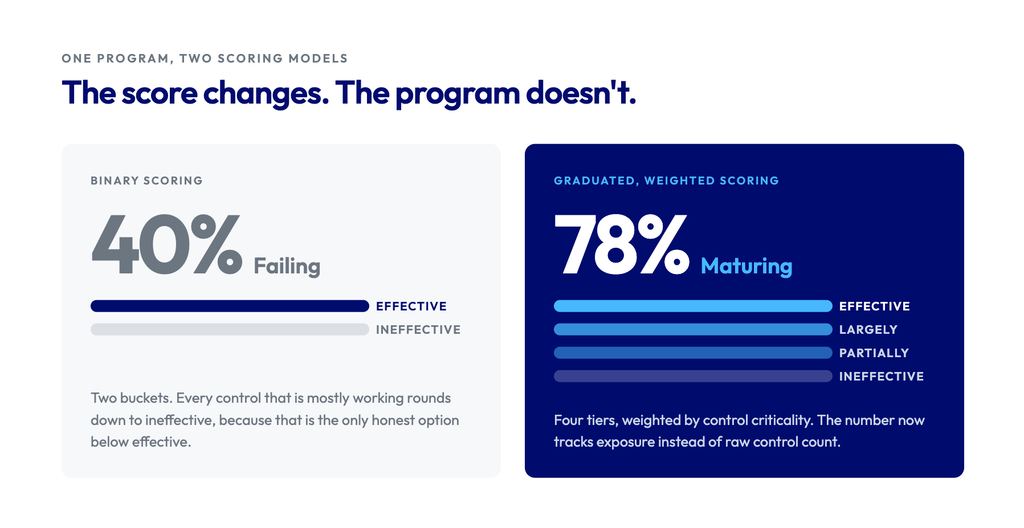
Most program health scores are built the same way: take every control tied to a program or framework, check whether each one is rated effective, and calculate the percentage that passes. When the underlying rating system only supports two states, effective and ineffective, every control that isn’t cleanly one or the other gets forced into whichever bucket is closest, and “closest” almost always means “ineffective,” because compliance teams are trained to round down on anything uncertain rather than overstate their posture.
That single design choice, two buckets instead of three or four, has a bigger downstream effect than it looks like. It doesn’t just distort the health score. It distorts the residual risk math sitting underneath it. Many programs calculate residual risk using some version of this formula: inherent risk multiplied by (1 minus control strength). If control strength comes from a binary effective or ineffective rating, a control that’s 80% of the way to fully operating either offsets 100% of the risk it addresses, or offsets none of it, with no in-between. That whipsaws the residual risk number the same way it whipsaws the health score, because both numbers are downstream of the same undersized rating scale.
None of this is a data entry problem. It’s an instrument problem. You can’t get a graduated answer out of a binary input, no matter how carefully the compliance team fills in the form.
Why This Erodes Trust Faster Than a Bad Score Would
A board that hears “our program health score is 62% this quarter, down from 71%, because we added a new framework and haven’t finished mapping controls to it yet” can work with that. It’s a number with a story attached, and the story is plausible.
A board that hears “our program health score is 40%” with no further explanation, when the actual state of the program is that most controls are substantially in place, and a handful are mid-remediation, has two possible reactions, and both are bad. Either they take the number at face value and redirect attention and budget toward a crisis that isn’t really there, or they start asking the compliance team to justify the number every single time it’s presented, which quietly signals that the metric itself, not just this quarter’s result, isn’t trusted. Once a board starts asking for the underlying detail behind every summary score, the summary score has stopped doing its job. The whole point of a single health metric is that leadership can act on it without re-deriving it from scratch each quarter.
The Data: How Often Programs Hit This Wall
This isn’t a one-off complaint. Across ZenGRC’s own customer conversations, it’s one of the more persistent structural gaps compliance teams flag once they’ve been running a program for a while.
| Signal | Frequency | Why it matters |
| Compliance teams asking for a “partially effective” rating option, not just effective/ineffective | 8+ separate customer conversations | Confirms the binary-rating problem isn’t one team’s edge case; it surfaces once a program has enough controls to have a normal spread of maturity |
| Compliance teams asking for graduated or weighted program health scoring instead of pass/fail | 7+ separate customer conversations | The scoring problem and the rating problem are connected; you can’t build a graduated score on top of a binary input |
| Executive and board reporting cited as a deciding factor in platform evaluations | ~21% of deals, over $1.3M in evaluated deal value | Reporting credibility isn’t a nice-to-have. It’s a top 10 factor buyers weigh when choosing how to run a program |
| Reporting cited as the primary blocker in lost evaluations | ~15% of lost deals | When reporting is the core pain, an unclear or unconvincing scoring model is often the reason a platform gets ruled out |
Put together, this is a mechanical problem with a real cost, not a cosmetic one. It shows up often enough, and matters enough to buyers and boards alike, that it’s worth fixing deliberately rather than working around quietly.
Three Fixes That Restore Credibility
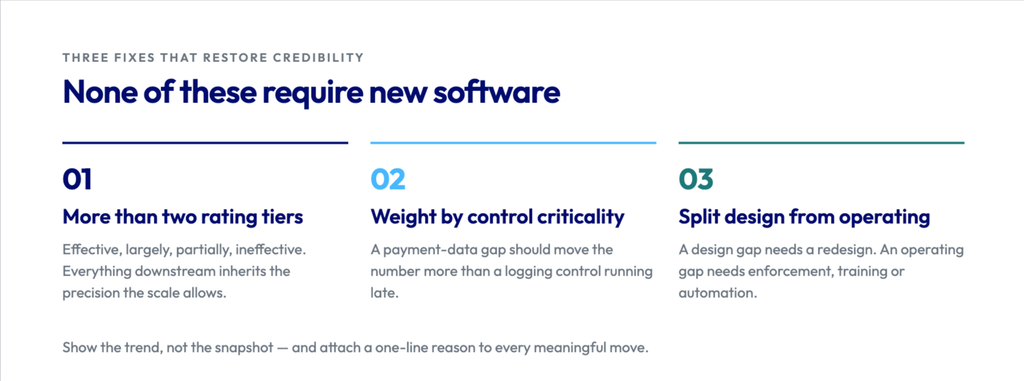
None of these require new software. They require deciding, on purpose, how the score gets built.
1. Use more than two rating tiers
If your control assessment process only supports “effective” and “ineffective,” every borderline control gets rounded in one direction, almost always down. A four-tier scale, something like effective, largely effective, partially effective, and ineffective, gives assessors a way to record what’s actually true instead of the closest available lie. This is the single highest-leverage fix, because everything downstream, the health score and the residual risk calculation both, inherits whatever precision the rating scale allows.
2. Weight controls by criticality
Not every control matters equally to the board. A control protecting customer payment data failing is not the same event as a low-risk logging control being slightly behind schedule, but a health score that treats every control as equally weighted reports them as if they were. Weighting the score by control criticality, so that a handful of high-risk gaps move the number more than a larger number of low-risk gaps, gives the board a score that tracks actual exposure instead of raw control count.
3. Separate design effectiveness from operational effectiveness
These are two different questions, and collapsing them into one rating hides which problem you actually have. Design effectiveness asks whether a control is built correctly to address the risk it’s meant to cover. Operational effectiveness asks whether that control is actually running as designed, consistently, in practice. A control can be well-designed but not yet fully operating (a new control, recently implemented) or poorly designed but technically running every time (a control that executes reliably but doesn’t actually address the risk). Reporting these separately tells the board which kind of gap they’re looking at, and that distinction changes what the right next step is: a design gap needs a policy or control redesign; an operating gap needs enforcement, training, or automation.
How to Present the Score So It Survives Contact with the Board
Fixing the scoring mechanics is half the work. The other half is how the number gets presented.
- Show the trend, not just the snapshot. A single point-in-time score invites the board to react to that one number. A trend line over the last four to six quarters gives them the context to judge whether a dip is a real problem or normal variation as the program matures or adds frameworks.
- Attach a one-line reason to every meaningful move. If the score drops, say why in the same breath: a new framework was added, a control was reclassified, an assessment cycle uncovered something real. A number with a reason attached reads as controlled. A number with no explanation reads as either bad news being hidden or bad news nobody understands.
- Don’t round a nuanced answer into a single color. Red/yellow/green is fine as a summary, but if the underlying data supports more nuance than three colors, don’t discard it before it reaches the board. Let them ask for the next level of detail if they want it, but make it available rather than pre-collapsed.
- Say what “ineffective” means before you use it as a category. If a rating of “ineffective” actually includes controls that are 80% of the way to fully operating, say so explicitly the first time you present it. That single clarification does more to prevent misread numbers than any dashboard redesign.
The Honest Caveat: Most Platforms, Including Ours, Are Still Catching Up
It would be easy to end this piece by saying a modern GRC platform solves all of this automatically. That’s not fully true yet, for ZenGRC or for most of the category. Native support for a true “partially effective” rating tier and for graduated, criticality-weighted program health scoring are still active feature requests inside ZenGRC’s own product roadmap, not delivered capabilities, as of this writing. Some teams work around this today with custom attributes or by splitting a single requirement across multiple controls to approximate a middle rating. That’s a real workaround, and it works, but it’s a workaround, not a native fix.
What is already true: separating design effectiveness from operational effectiveness as distinct assessed dimensions is something modern GRC platforms, including AI-assisted control assessment tools, are increasingly built to support directly, because it’s a cleaner data model problem than graduated scoring turned out to be. If you’re evaluating any platform against this framework, see how to build a compliance risk assessment template and ask directly which of the three fixes above are native today versus which require a workaround. The honest answer, from any vendor, is more useful to you than a demo that glosses over which is which.
FAQs
Why does my program health score look worse than my program actually is?
The most common cause is a binary rating scale. If your control assessments only support “effective” and “ineffective,” every control that’s partially implemented or mostly working gets rated “ineffective” by default, since there’s no accurate middle option. The health score, calculated from those ratings, ends up understating a program that’s actually in reasonable shape.
What is the difference between design effectiveness and operational effectiveness?
Design effectiveness measures whether a control is built to properly address the risk it’s meant to cover. Operational effectiveness measures whether that control is actually functioning as designed in practice, consistently, over time. A control can pass one and fail the other, and reporting them as a single combined rating hides which specific problem exists.
Should I weight controls by criticality in a program health score?
Yes, if the goal is a score that reflects actual risk exposure rather than raw control count. An unweighted score treats a failing low-risk control the same as a failing high-risk control, which can make a program look stable when a genuinely serious gap exists, or look worse than it is when only minor items are behind.
How many rating tiers should a control effectiveness scale have?
Four tiers is a practical minimum for most programs: effective, largely effective, partially effective, and ineffective. Fewer than that forces borderline controls into whichever extreme is closest, almost always understating the program. More than four or five tiers tends to introduce more subjectivity between assessors than it resolves.
How often should program health scores be presented to the board?
Quarterly is standard for most compliance programs, matched to board or audit committee cadence. What matters more than frequency is consistency: presenting a trend over several consecutive periods, with the same scoring methodology each time, so the board can judge direction and context rather than reacting to an isolated number.
Can I fix this without new software?
Partially. Weighting controls by criticality and separating design from operational effectiveness in your reporting can be done with existing tools and a documented methodology change. A true graduated rating scale is harder to retrofit if your current system only supports binary control status, since the underlying data was never captured with that granularity in the first place.